Hurricanes are unpredictable. Understanding the Hurricane which is produced by NOAA is vital.
Creating A Graphic Track
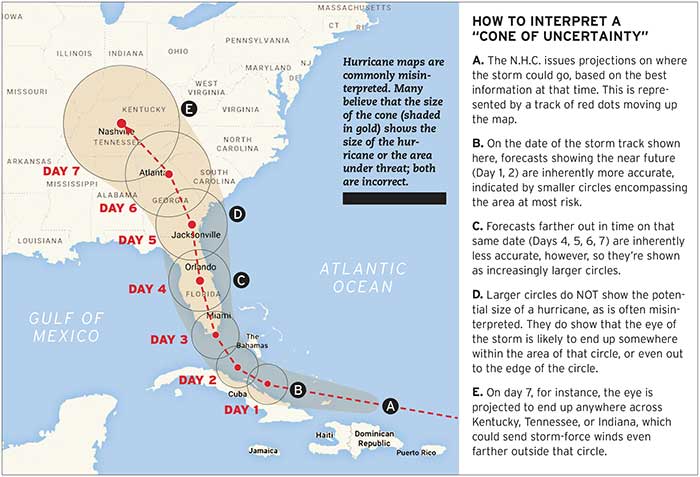
When a hurricane is forecast, the National Hurricane Center (NHC), part of NOAA, produces a map of the likely track of the hurricane. Some boaters look at the map and wrongly assume that the widening cone shows the hurricane getting larger over time. Others think that the circles drawn on the map represent areas that will be affected by the hurricane, and that everything outside the circles are safe — also very wrong. These misconceptions leave many boaters either totally unprepared or poorly prepared for the storm, vulnerable to serious damage or total loss of their boats as a consequence.
What Do Those Circles Mean?
On any good hurricane tracking forecast map, there are dots representing, day by day, how far the storm is expected to travel and where the CENTER of the storm may be. But hurricanes are very unpredictable, so a circle is drawn around each dot on the projected track. The circle is NOT, as is often assumed, the extent of the storm. And the circle is NOT showing the outer edges of the storm. It shows only where the possible CENTER of the storm may end up, which is somewhere within that circle. If the eye of the storm ends up on the edge of that circle, the ramifications for the locations all around it can be dire, including locations far outside the circle.
Cone Of Uncertainty
The predicted circles are joined with lines on each side. These form what is often called the "cone of uncertainty." The eventual track of the storm may be anywhere inside that cone, but even this is not certain. It's important to note that the cone of uncertainty is usually greater as you extend out in time, because it's easier to predict the course of the storm tomorrow but more difficult to know where it'll be next week.
BASED ON AN ARTICLE IN BOATUS